Solar
The Solar page provides a detailed view of your system’s solar generation — from live output to a 7-day ahead production forecast. Whether you’re checking whether today’s clouds will affect your export earnings or comparing this month’s yield to last month’s, Solar is the place to start.
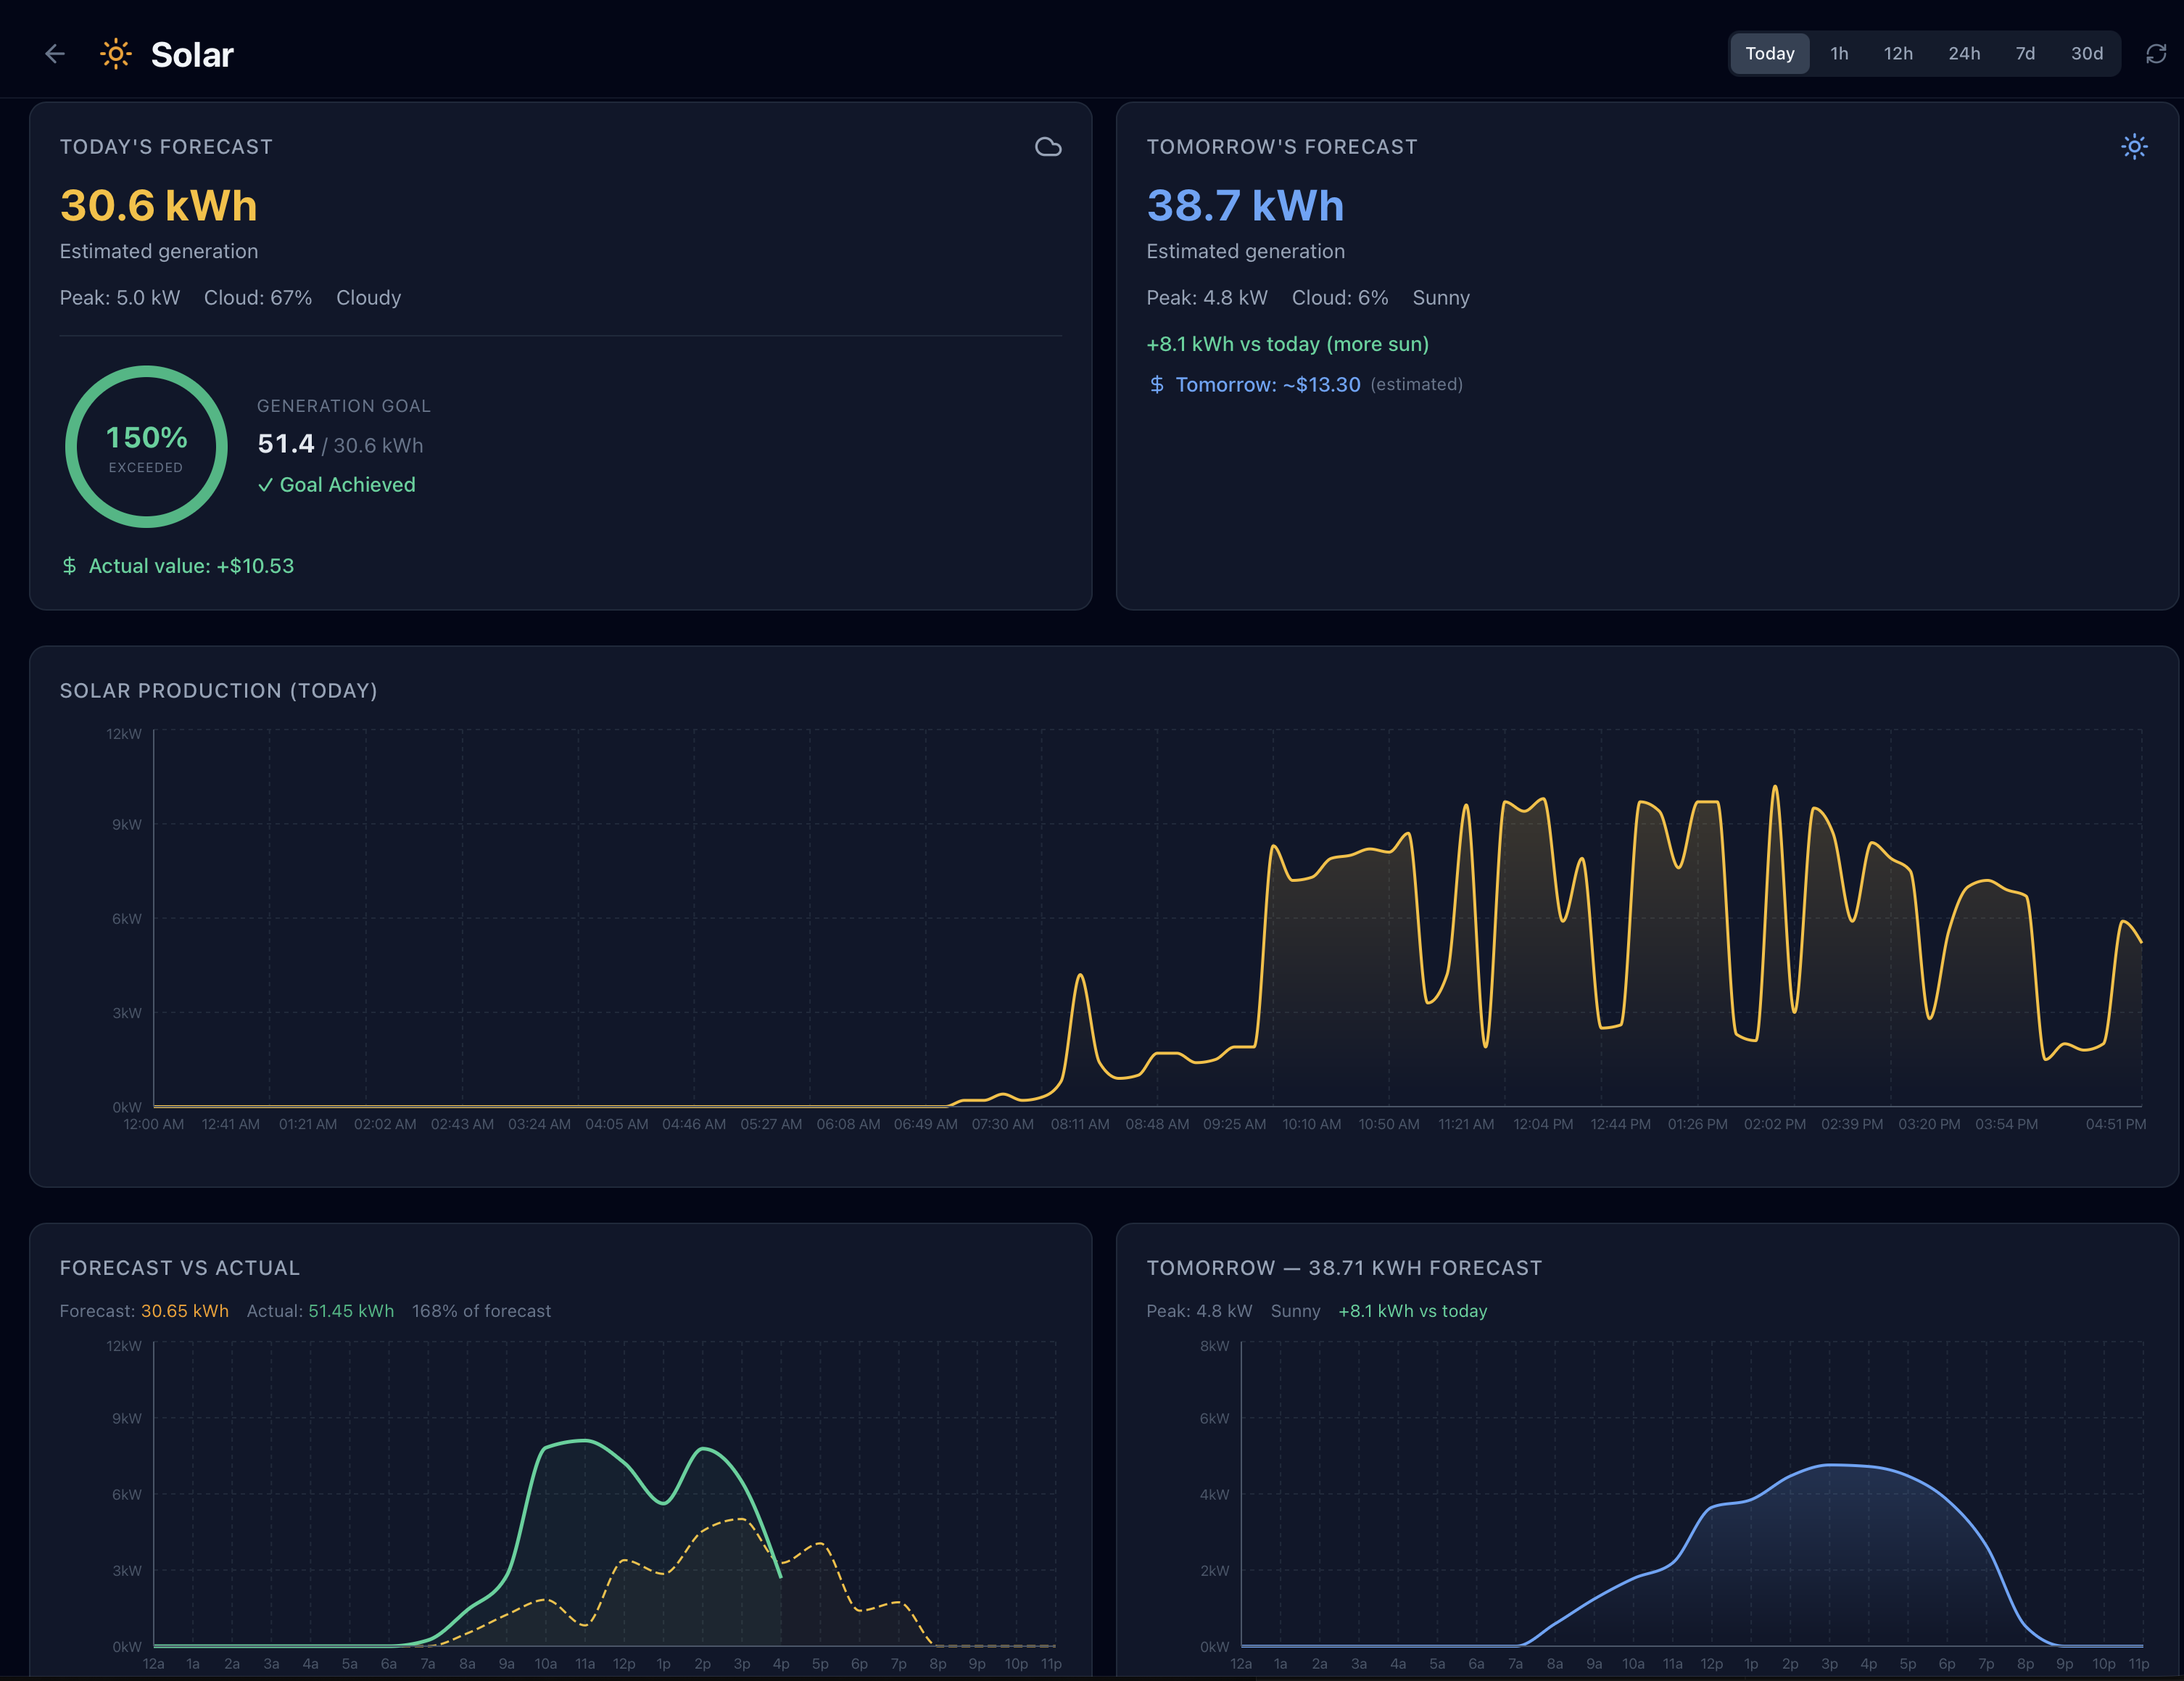
Solar Generation Tile
At the top of the Solar page, the generation tile gives you an immediate read on current performance:
- Current output — live solar generation in kW, updating in real time
- Today’s total — cumulative kWh generated since midnight
- Generation goal — if you’ve set a daily solar goal in settings, a progress bar and percentage shows how close today’s yield is to that target
The tile uses green coloring when generation is strong relative to forecast, and amber when output is significantly below what was predicted for current conditions — a quick visual cue that something may be worth investigating.
7-Day Forecast Chart
GridMind generates a solar production forecast using weather data from Open-Meteo, calibrated to your specific panel configuration (capacity, tilt, azimuth, and efficiency). The forecast updates multiple times daily as the weather model refreshes.
The chart displays 7 days centered on today:
- Blue bars — actual generation data for past and current days
- Amber bars — forecasted generation for upcoming days
- TOU rate bands — semi-transparent background shading shows when peak and off-peak hours occur throughout each day, so you can visually see whether peak solar output coincides with your most valuable export windows
Tomorrow’s forecast card appears alongside the chart and shows:
- Predicted total generation in kWh
- Weather condition icon (sunny, mostly sunny, partly cloudy, overcast, or rain)
- Daytime high temperature for the location
Forecast accuracy: For the most accurate forecast, enter your panel tilt with a smartphone inclinometer app and confirm your azimuth is true south rather than magnetic south. In most of the continental US, magnetic and true south differ by 10–15°.
Power Timeline
The power timeline chart shows your solar output over a selected time window. Use the range controls above the chart to switch views:
| Range | Resolution | Description |
|---|---|---|
| Today | Per-minute | Live minute-by-minute output from midnight to now |
| 1h | Per-minute | Rolling 60-minute window |
| 12h | 5-minute | Last 12 hours of output |
| 24h | 5-minute | Full previous 24-hour period |
| 7 days | Hourly | Hourly bars for the past week |
| 30 days | Daily | Daily production bars for the past month (Pro) |
Pro The 30-day range and any ranges beyond 7 days require a Pro subscription.
TOU overlays appear as background shading bands on all time ranges, making it easy to see when your solar production aligned with high-value peak hours versus off-peak windows.
Daily Summaries
Below the timeline chart, a table provides a day-by-day breakdown of solar performance. Each row shows:
| Column | Description |
|---|---|
| Date | Calendar date |
| Total generation | Total kWh produced that day |
| Peak output | Highest instantaneous kW recorded that day |
| Hours of production | Hours during which output exceeded 0.1 kW (proxy for effective sun hours) |
| Weather summary | Descriptive condition (e.g., “Sunny”, “Mostly Cloudy”, “Rain AM”) |
Rows for forecast days (tomorrow and beyond) show the predicted values in a lighter style to distinguish them from actuals. Click any row to open a detailed day view with hourly breakdown.
Panel Configuration
Solar forecast accuracy depends on correctly configured panel specifications in Settings → Location & Solar. You can configure up to 4 separate solar arrays, each with its own orientation — ideal for split-roof installations where panels face different directions.
For each array, the settings that most significantly affect forecast quality are:
| Setting | Example | Description |
|---|---|---|
| Name | South Roof | A label to identify this array |
| Capacity | 8.5 kW | DC nameplate capacity of panels in this array. This is the number on your installation permit, not the inverter rating. |
| Tilt | 30° | Angle of panels from horizontal. 0° = flat roof, 90° = vertical wall. Most residential roofs fall between 15° and 40°. |
| Azimuth | 180° | Compass direction the panels face. 180° = due south, which is optimal for maximum annual yield in North America. East- or west-facing arrays should be set to 90° or 270°. |
Shared efficiency settings apply to all arrays:
| Setting | Example | Description |
|---|---|---|
| DC/AC Ratio | 1.2 | Ratio of total panel DC capacity to inverter AC capacity. Most systems are between 1.0 and 1.4. |
| Inverter Efficiency | 96% | Conversion efficiency of your inverter. |
| System Losses | 14% | Combined losses from wiring, soiling, shading, and panel degradation. New systems typically run 10–15%; older systems may be higher. |
Multiple arrays: If your panels face two or more directions (e.g., south-facing and west-facing), add a separate array for each orientation. GridMind fetches a tailored irradiance forecast for each unique orientation, then sums them for a more accurate total production forecast than a single averaged configuration.
Calibration tip: After a clear, sunny day with no shading, compare your actual generation to what was forecast. If actual is consistently higher, try increasing efficiency by a few percent. If it’s consistently lower, check for partial shading or enter a lower efficiency value. Small adjustments of 3–5% can noticeably improve 7-day forecast accuracy.
Understanding Forecast vs. Actual Gaps
Some variance between forecast and actual generation is normal — weather models are not perfect. Here are the most common reasons for larger-than-expected gaps:
Overcast forecast, sunny actual — the weather model predicted cloud cover that didn’t materialize. Open-Meteo updates forecasts every few hours, so day-of forecasts are typically more accurate than 5-day forecasts.
Sunny forecast, low actual — possible causes include temporary shading (a neighbor’s new tree, construction equipment, or accumulated soiling on panels), inverter clipping on high-irradiance days, or a grid curtailment event by your utility.
Morning or evening discrepancy — low-angle sun at dawn and dusk is harder for models to predict accurately due to atmospheric haze and horizon obstructions not captured in the panel configuration. Small gaps at the edges of the production day are common and expected.
Consistent under-forecast — if actual regularly exceeds forecast by 10%+ on clear days, increase the efficiency setting. If using a microinverter system (e.g., Enphase), the true efficiency may be higher than the 85% default because microinverters eliminate string-level shading losses.