History
The History page gives you full access to your energy data over time — from minute-by-minute readings to long-term trends.
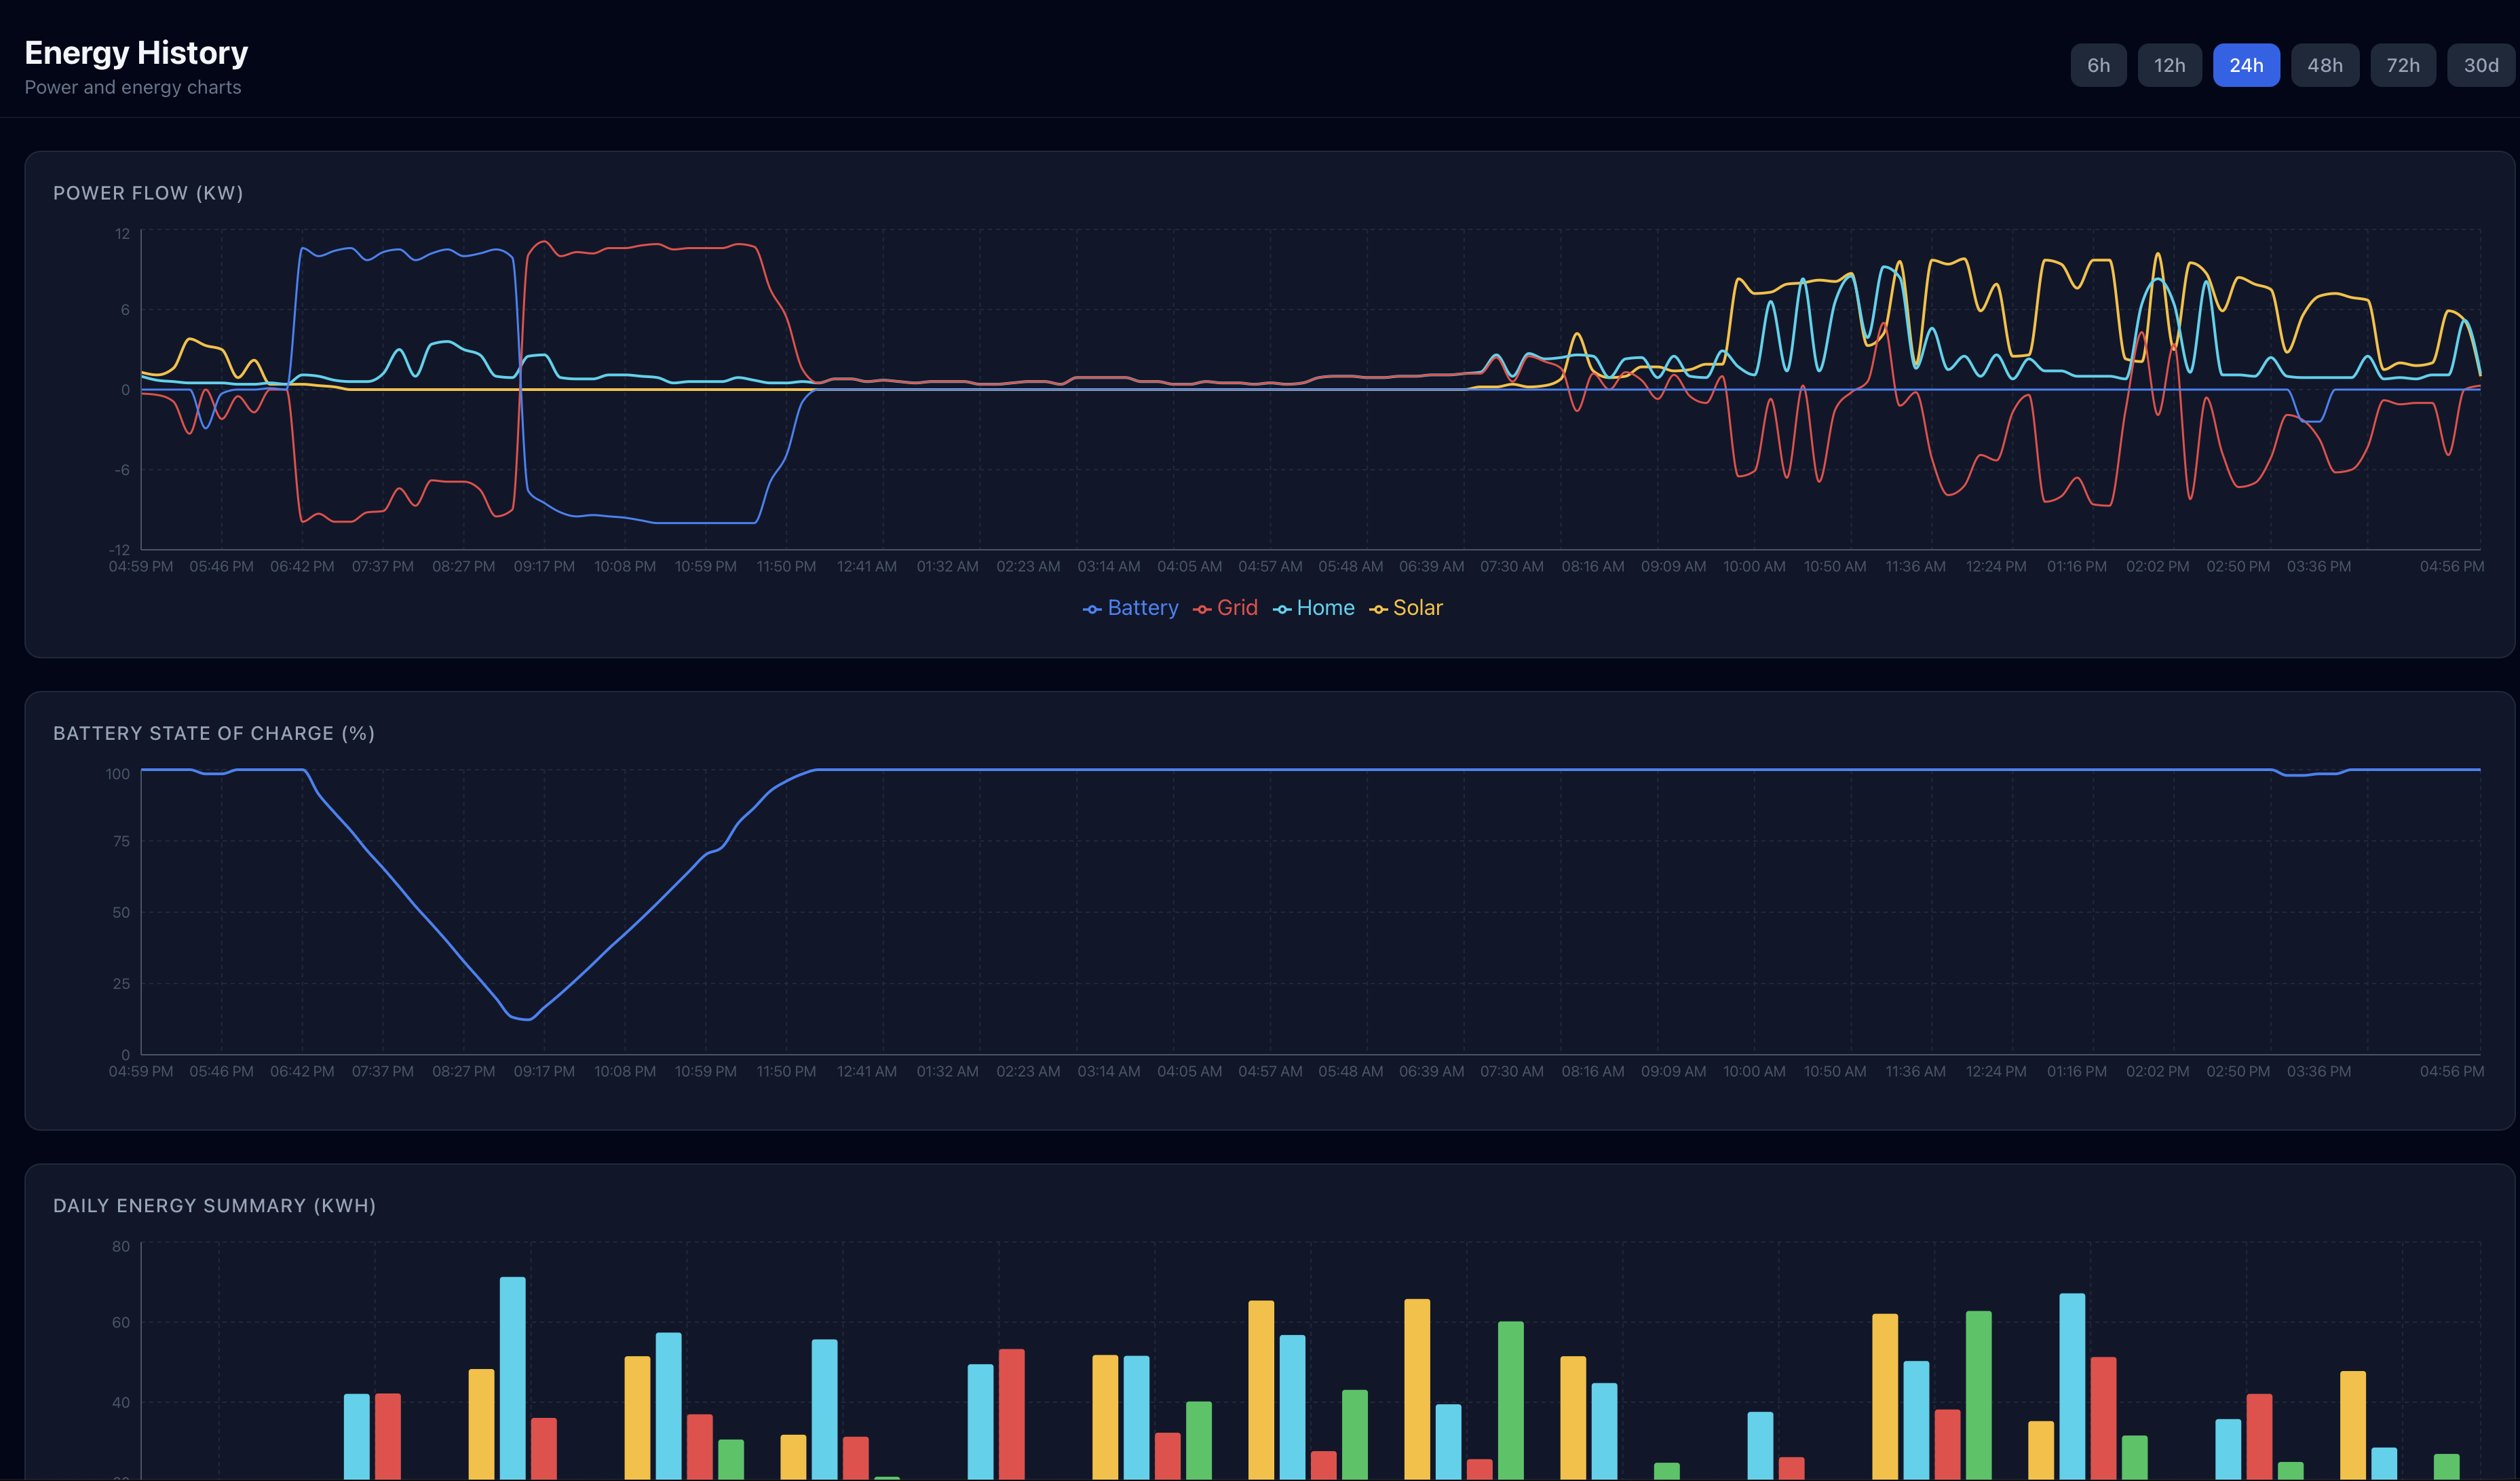
Time-Series Chart
The main chart displays energy readings over your selected time range. You can view:
- Solar generation (kW)
- Battery SOC (%)
- Grid import/export (kW)
- Home consumption (kW)
- Vehicle charging (kW)
Toggle individual data series on or off by clicking their legends.
Time Range Options
- Today: Minute-by-minute data for the current day
- 1 hour: Last 60 minutes of readings
- 12 hours: Last 12 hours
- 24 hours: Last 24 hours
- 7 days: Daily summary bars for the past week
- 30 days: Monthly trend view Pro
30-day and longer history views require a Pro subscription. Free plan includes up to 7 days of history.
Daily Energy Summary Table
Below the chart, a table shows daily energy totals:
| Date | Solar (kWh) | Home (kWh) | Grid Import (kWh) | Grid Export (kWh) | Battery Cycles | Value ($) |
|---|---|---|---|---|---|---|
| Your daily energy data will appear here | ||||||
Rows can be sorted by any column. Click a date row to zoom the chart to that specific day.
Day Comparison
The Compare tab lets you pick any two dates and see their energy totals side by side. Each metric shows a delta indicator — green when the change is favorable (more solar, less grid import) and red when it’s not.
How to use it
- On the History page, switch to the Compare tab (iOS) or scroll to the Day Comparison section (web)
- Pick two dates using the date pickers — defaults to yesterday vs today
- View side-by-side totals for Solar, Home, Imported, Exported, Battery Charged, and Battery Discharged
- When today is selected, a Solar Forecast row shows your full-day forecast and current pace
Yesterday summary
Both the iOS and web dashboards include a compact “Yesterday” card showing the previous day’s key metrics at a glance. Tap it to jump to the full comparison view.
Use cases
- Morning check: see yesterday’s full summary and compare against today’s forecast
- Seasonal comparison: pick the same date from last month to see how production has changed
- Before/after: compare the day before and after a system change (new panels, battery settings, etc.)
What Data Is Stored
GridMind stores:
- Power readings at 60-second intervals (solar, battery, grid, home, vehicle)
- Daily energy summaries (kWh totals for each channel)
- Charge/discharge cycle records
- Grid outage events
- Rule execution logs
- VPP event records
GridMind stores your energy data securely in the cloud. Data is never deleted — even if you downgrade from Pro to Free, your historical data is preserved and accessible again if you re-upgrade.
Data Retention
- Free plan: Last 7 days of minute-by-minute readings; unlimited daily summaries
- Pro plan: Unlimited minute-by-minute readings; unlimited daily summaries