Home Consumption
Understanding how much electricity your home uses — and when — is key to optimizing your energy system. The Home Consumption page shows you real-time and historical load data alongside your solar generation, so you can see exactly how self-sufficient your system is and where opportunities exist to improve it.
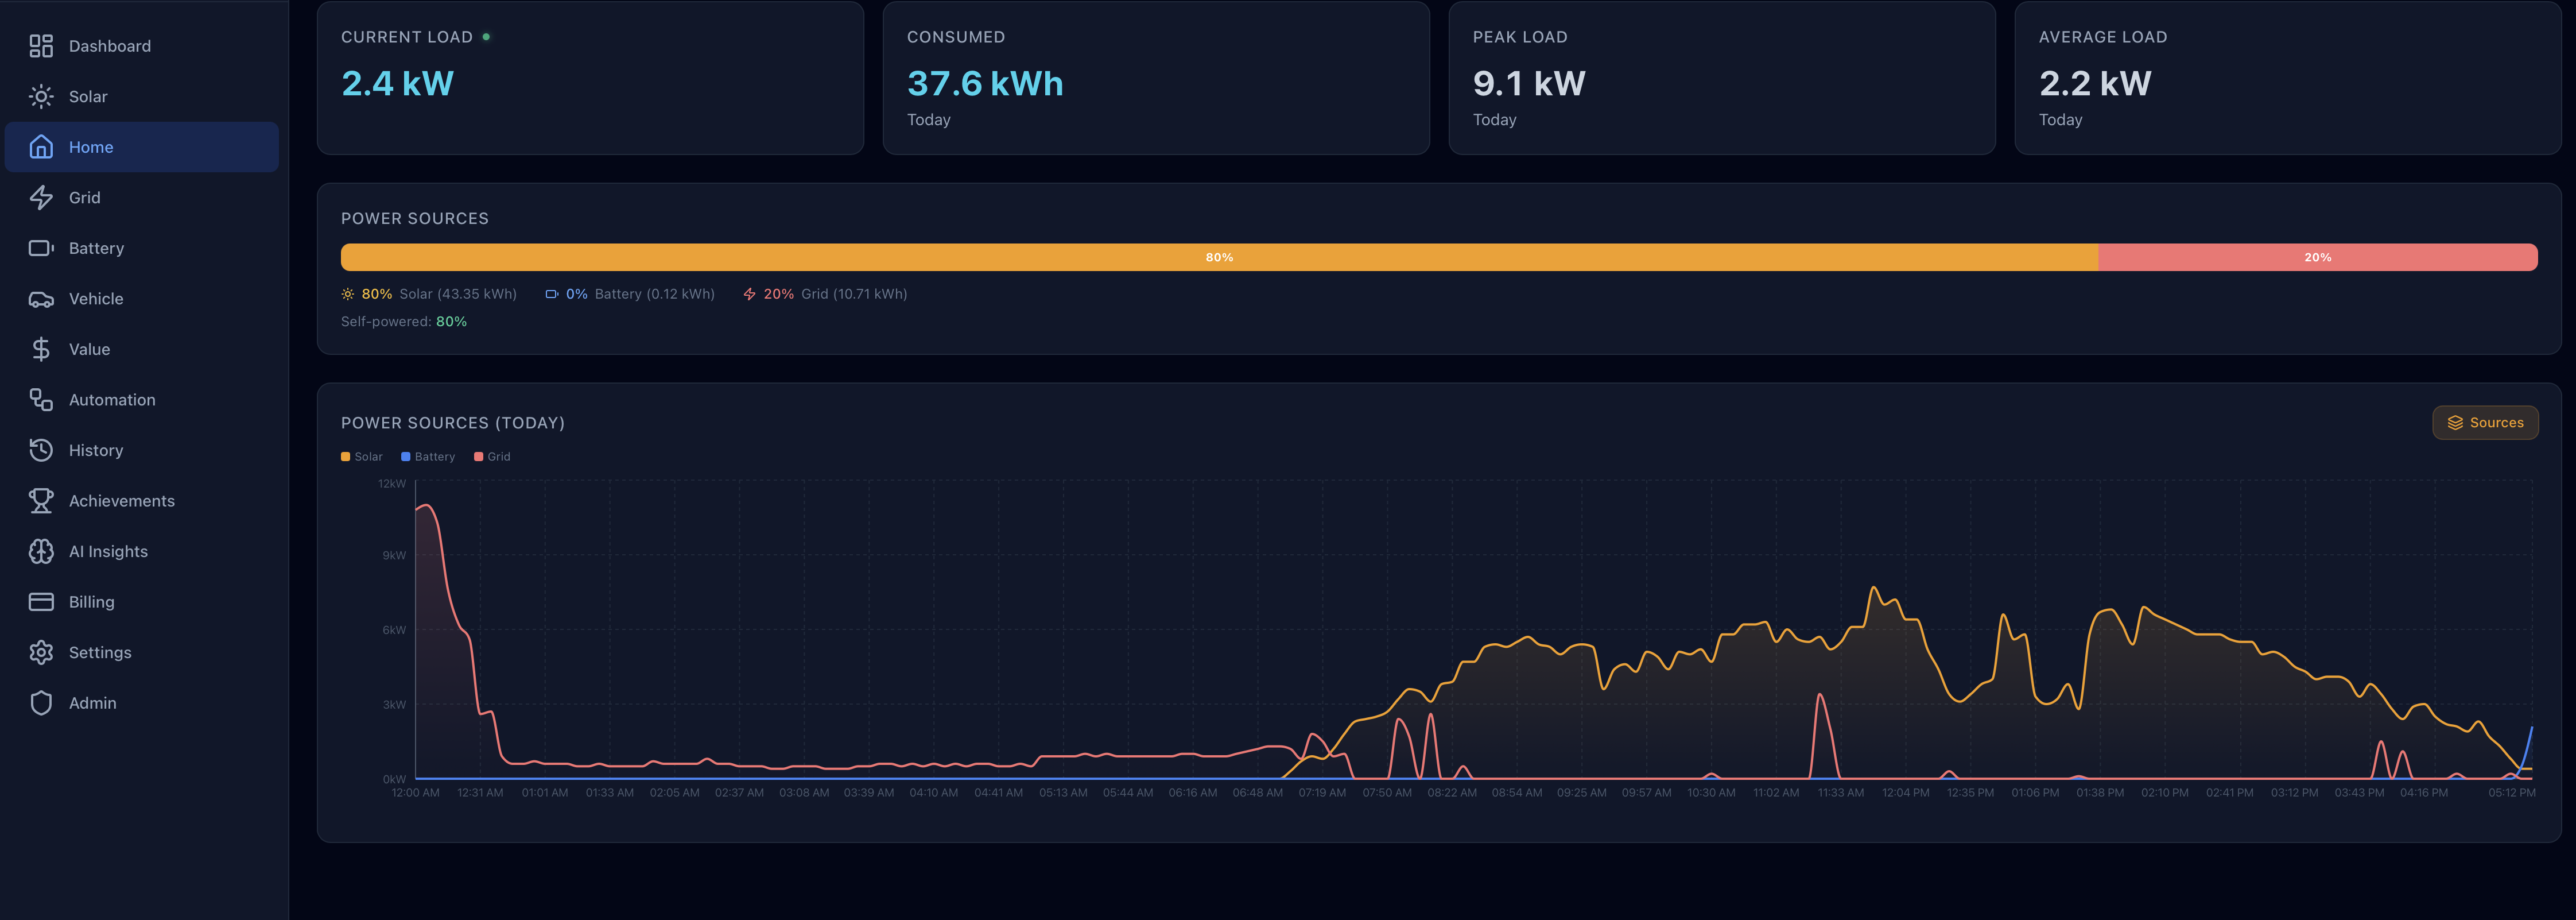
Current Home Load
The main tile at the top of the page shows:
- Current home consumption (kW) — your home’s real-time electricity demand, updated every 30 seconds
- Today’s total consumption (kWh) — cumulative energy your home has consumed since midnight
For Tesla Powerwall users, home consumption is not directly measured but is derived from the other values reported by your gateway:
home = solar_output + battery_discharge + grid_import − battery_charge − grid_export − vehicle_chargingThis calculation ensures that energy flowing to your Wall Connector is attributed to vehicle charging rather than general home consumption, giving you a more accurate picture of your home’s actual load.
Power Timeline
A chart shows your home consumption over time, with TOU rate band shading overlaid in the background. This view helps you:
- Identify morning and evening usage spikes — HVAC startup, cooking, and lighting all show up clearly
- Correlate consumption peaks with grid import periods — see whether high-demand moments are coinciding with your battery being depleted or solar being unavailable
- Spot opportunities to shift loads to off-peak hours — running dishwashers, laundry, and EV charging during the unshaded off-peak window reduces your bill
Daily Consumption Summary
A table shows daily consumption totals for historical comparison:
- Date
- Total consumed (kWh) — everything your home used that day
- Solar-powered portion (kWh) — the share of consumption that was covered directly by solar or by battery charged from solar
- Grid-powered portion (kWh) — the share that required grid import
- Self-sufficiency % — the proportion of your home’s consumption powered by solar and battery combined; 100% means you ran entirely on clean energy that day
Self-sufficiency is the primary metric for understanding how well your solar and battery system is covering your home’s needs. High self-sufficiency days are typically sunny days where your battery was well-charged heading into the evening.
Solar vs. Consumption
A side-by-side comparison view shows daily solar generation versus home consumption for each day in the selected range. Two bars are drawn for each day — one for generation and one for consumption — making it easy to see the relationship at a glance:
- Generation exceeds consumption — you exported surplus energy to the grid that day, earning NEM credits
- Consumption exceeds generation — you imported energy from the grid that day to supplement solar and battery
Over a full billing cycle, the net of these days determines whether you’re a net importer or net exporter, which has significant implications for your utility bill.
If your home consistently consumes more than your solar generates, consider enabling GridMind Optimize to maximize the value of your battery during peak hours rather than just self-consumption. Shifting export to peak windows can significantly improve the financial return from your system.
Time Range Selector
Use the time range tabs to view consumption data at different levels of granularity:
- Today — minute-by-minute consumption chart for the current day
- 1h / 12h / 24h — sliding windows showing the most recent hour, 12 hours, or 24 hours of data
- 7 days — daily totals displayed as a bar chart, useful for week-over-week comparison
- 30 days — monthly trend showing daily consumption, solar coverage, and self-sufficiency Pro