Dashboard
The dashboard is your command center — a real-time view of every energy flow happening in your home, right now. From a single screen you can see your solar output, battery state, grid relationship, and vehicle charging power, all updating live as conditions change.
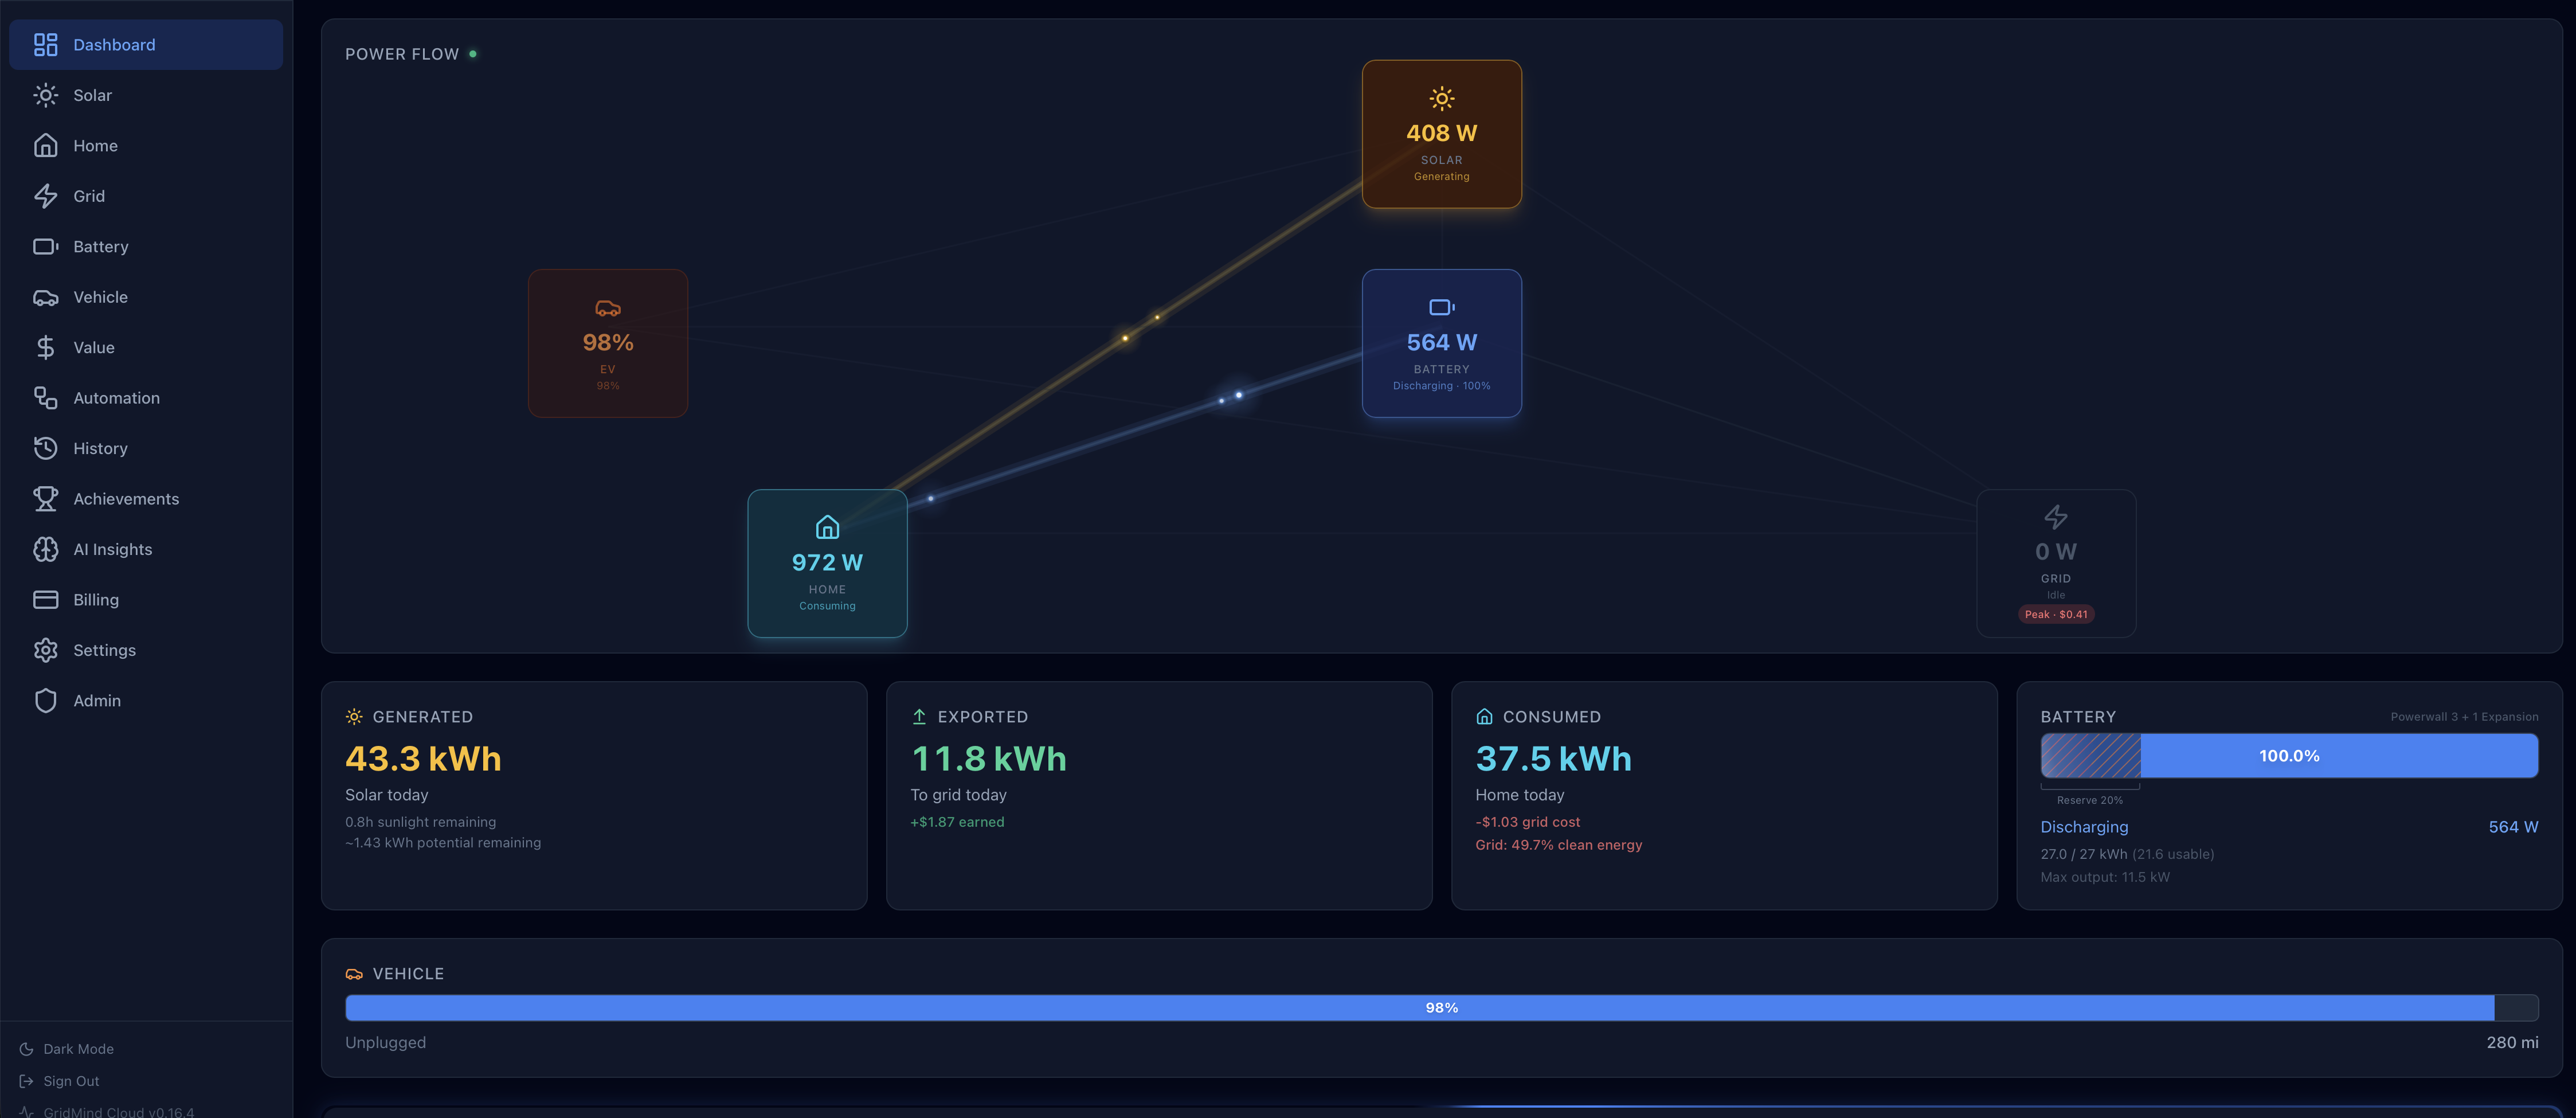
Power Flow Diagram
The animated power flow diagram sits at the center of the dashboard. It displays five energy nodes and the live flows connecting them:
- Solar (top center) — current solar generation output in kW
- Battery (center) — state of charge as a percentage, plus current charge or discharge rate in kW
- Home (bottom left) — current home consumption load in kW
- Grid (bottom right) — net grid interaction: positive means importing, negative means exporting
- Vehicle(s) (left side) — per-EV charging power, shown when a vehicle is plugged in at home
Animated arrows travel between nodes to show the direction energy is currently flowing. Arrow thickness scales with power level — a thin arrow means a trickle of power, a thick arrow means high throughput. When a flow is zero, the arrow fades out entirely.
Multi-vehicle homes: Up to four vehicles can appear simultaneously on the left side of the diagram, each labeled with the vehicle name and showing its individual charging power from the Wall Connector.
Vehicle Cards
ProOn the iOS app, Pro users with two or more vehicles see a row of compact vehicle cards below the power flow diagram. Each card shows:
- Vehicle name and vendor icon with brand color
- Battery level with a mini bar gauge and color coding (green above 40%, amber 20–40%, red below 20%)
- Charging state — “Charging” with live power (kW), or the current status (Complete, Stopped, Disconnected)
Tap any vehicle card to select it and navigate directly to the Vehicle tab with that vehicle’s full detail view. The vehicle cards load efficiently alongside the dashboard and update when you return to the dashboard after charging activity.
Free users see their primary vehicle in the power flow diagram but do not see the multi-vehicle card row.
Battery Gauge
The circular gauge at the center of the power flow diagram provides a quick read on your battery:
- State of charge (SOC) displayed as a percentage (e.g., 85%)
- Charge rate shown below the percentage — positive kW means the battery is charging, negative kW means it is discharging
- Color coding:
- Green ring — battery is actively charging
- Amber ring — battery is discharging
- Gray ring — battery is idle (not charging or discharging)
When GridMind Optimize is active, a small “Optimize” badge appears on the gauge to indicate the battery is under automated control.
Status Tiles
Below the power flow diagram, a row of status tiles provides at-a-glance readings for today’s running totals:
| Tile | What It Shows |
|---|---|
| Solar | Total generated today (kWh) + current output (kW) |
| Battery | State of charge % + current operation mode |
| Grid | Import or export kWh accumulated today |
| Home | Total consumed today (kWh) |
| Vehicle | Combined charging power across all EVs + count of plugged-in vehicles |
Tapping or clicking any tile navigates to the full detail page for that category.
GridMind Optimize Card
ProWhen GridMind Optimize is enabled, a card below the status tiles shows the current automated strategy status. The card updates in real time as Optimize moves through its phases:
- Idle — Optimize is monitoring conditions, no peak window is currently active or imminent.
- Pre-charging — Optimize has determined the battery should be charged ahead of an upcoming peak window. The target charge level and estimated completion time are shown.
- Peak active — A peak window is in progress. Optimize is discharging the battery to maximize export or minimize import, depending on your rate structure.
- Complete — The peak window ended. Battery settings have been restored to their baseline and the final session summary (kWh exported, estimated value) is displayed.
Click the card to expand it and read the reasoning behind the current decision — including the forecast data and battery projections that drove the strategy.
VPP Event Indicator
During an active Virtual Power Plant event, the dashboard shifts into an event-mode display:
- The dashboard accent color changes to purple to signal an event is in progress
- An event status banner shows the event name, current phase, and time remaining
- A live earnings counter updates in real time, calculating dollars earned based on current export rate and kW exported
- The total earnings accumulated for this event session are shown at a glance
See the VPP Events guide for how to enroll and configure event notifications.
Storm Watch Banner
GridMind monitors a 7-day weather forecast for your location. When severe weather is detected — thunderstorms, high winds, heavy precipitation — Storm Watch activates automatically.
A prominent yellow banner appears at the top of the dashboard indicating:
- Storm Watch is active and the reason (e.g., “Severe thunderstorm watch issued for your area”)
- The battery is being charged to 100% as a backup precaution
- The estimated time to full charge at the current charging rate
Storm Watch overrides any active Optimize schedule for the duration of the event. Once the weather alert clears, your settings automatically return to normal.
AI Anomaly Alerts
ProIf the GridMind AI model detects unusual energy patterns — such as unexpected overnight consumption, abnormal solar underperformance relative to forecast, or anomalous battery behavior — a yellow alert badge appears at the top of the dashboard.
The badge shows the number of unreviewed anomalies. Click it to navigate to the AI Insights page for a full explanation of each detected anomaly, including what was observed, why it is unusual, and suggested next steps.
Grid Clean Energy Badge
A small badge on the Grid status tile shows the current percentage of clean energy in your local grid mix — sourced from the U.S. Energy Information Administration (EIA) in near real time.
- Green badge (>70% clean) — the grid is predominantly powered by wind, solar, hydro, or nuclear. This is a good time to import if needed.
- Amber badge (40–70% clean) — the grid mix is moderate. Battery and solar self-consumption are preferred.
- Red badge (<40% clean) — the grid is heavily fossil-fueled. Prefer battery discharge over grid import.
This indicator is available for U.S. grid regions that publish real-time generation mix data to the EIA.
Today’s Totals Bar
A compact summary bar at the bottom of the dashboard shows running totals for the current calendar day:
- Solar generated — total kWh produced by your solar panels since midnight
- Exported to grid — total kWh sent to the utility grid today
- Imported from grid — total kWh drawn from the utility grid today
- Net energy value — estimated dollar value of today’s net energy activity, based on your configured TOU rates
The net value calculation uses your export rate (NEM credit) for exported kWh and your peak/off-peak rates for imported kWh, blended across the actual time periods of each flow.
All Sites Dashboard
ProPro users with multiple energy systems see an All Sites option in the site picker. Selecting it switches the dashboard to a combined aggregate view that shows:
- Combined power totals — total solar generation, home consumption, grid import/export, and battery state across all sites, updated in real time
- Per-site summary cards — each site shown as a clickable card with its name, current solar output, home load, grid status, and battery SOC. Click any card to switch directly to that site’s full dashboard
- Today’s combined energy — aggregated kWh totals for solar generated, grid imported, grid exported, home consumed, battery charged, and battery discharged across all locations
The aggregate view is read-only — battery controls, Optimize, and automations are configured per-site from each individual site’s dashboard.
Connection Status Indicator
A small indicator in the corner of the dashboard shows the real-time data connection status:
- Live (green dot) — a WebSocket connection is active and data is updating in real time, typically refreshing every few seconds as new readings arrive from your system.
- Polling (gray dot) — the WebSocket connection is unavailable (e.g., the app is backgrounded on mobile or your network dropped temporarily). Data refreshes automatically every 30 seconds via HTTP polling.
- Offline — no connection to GridMind servers. Data shown reflects the last successfully received reading. The timestamp of the last update is displayed so you know how stale the data is.
The app reconnects automatically when connectivity is restored — no manual refresh is needed.