Grid
The Grid page shows your relationship with the utility grid — how much power you’re importing and exporting, what kind of energy you’re receiving from the grid, and how your usage aligns with your time-of-use rate schedule.
Grid Power Tile
The main grid tile at the top of the page gives you an instant summary of your grid relationship:
- Current grid power (kW) — positive values mean you’re importing power from the grid; negative values mean you’re exporting power to the grid
- Status badge — Connected (grid is up and operating normally), Backing Up (grid is down and your battery is powering your home), or Offline (GridMind cannot reach your gateway)
- Today’s import total (kWh) — cumulative grid energy consumed so far today
- Today’s export total (kWh) — cumulative solar energy sent to the grid so far today
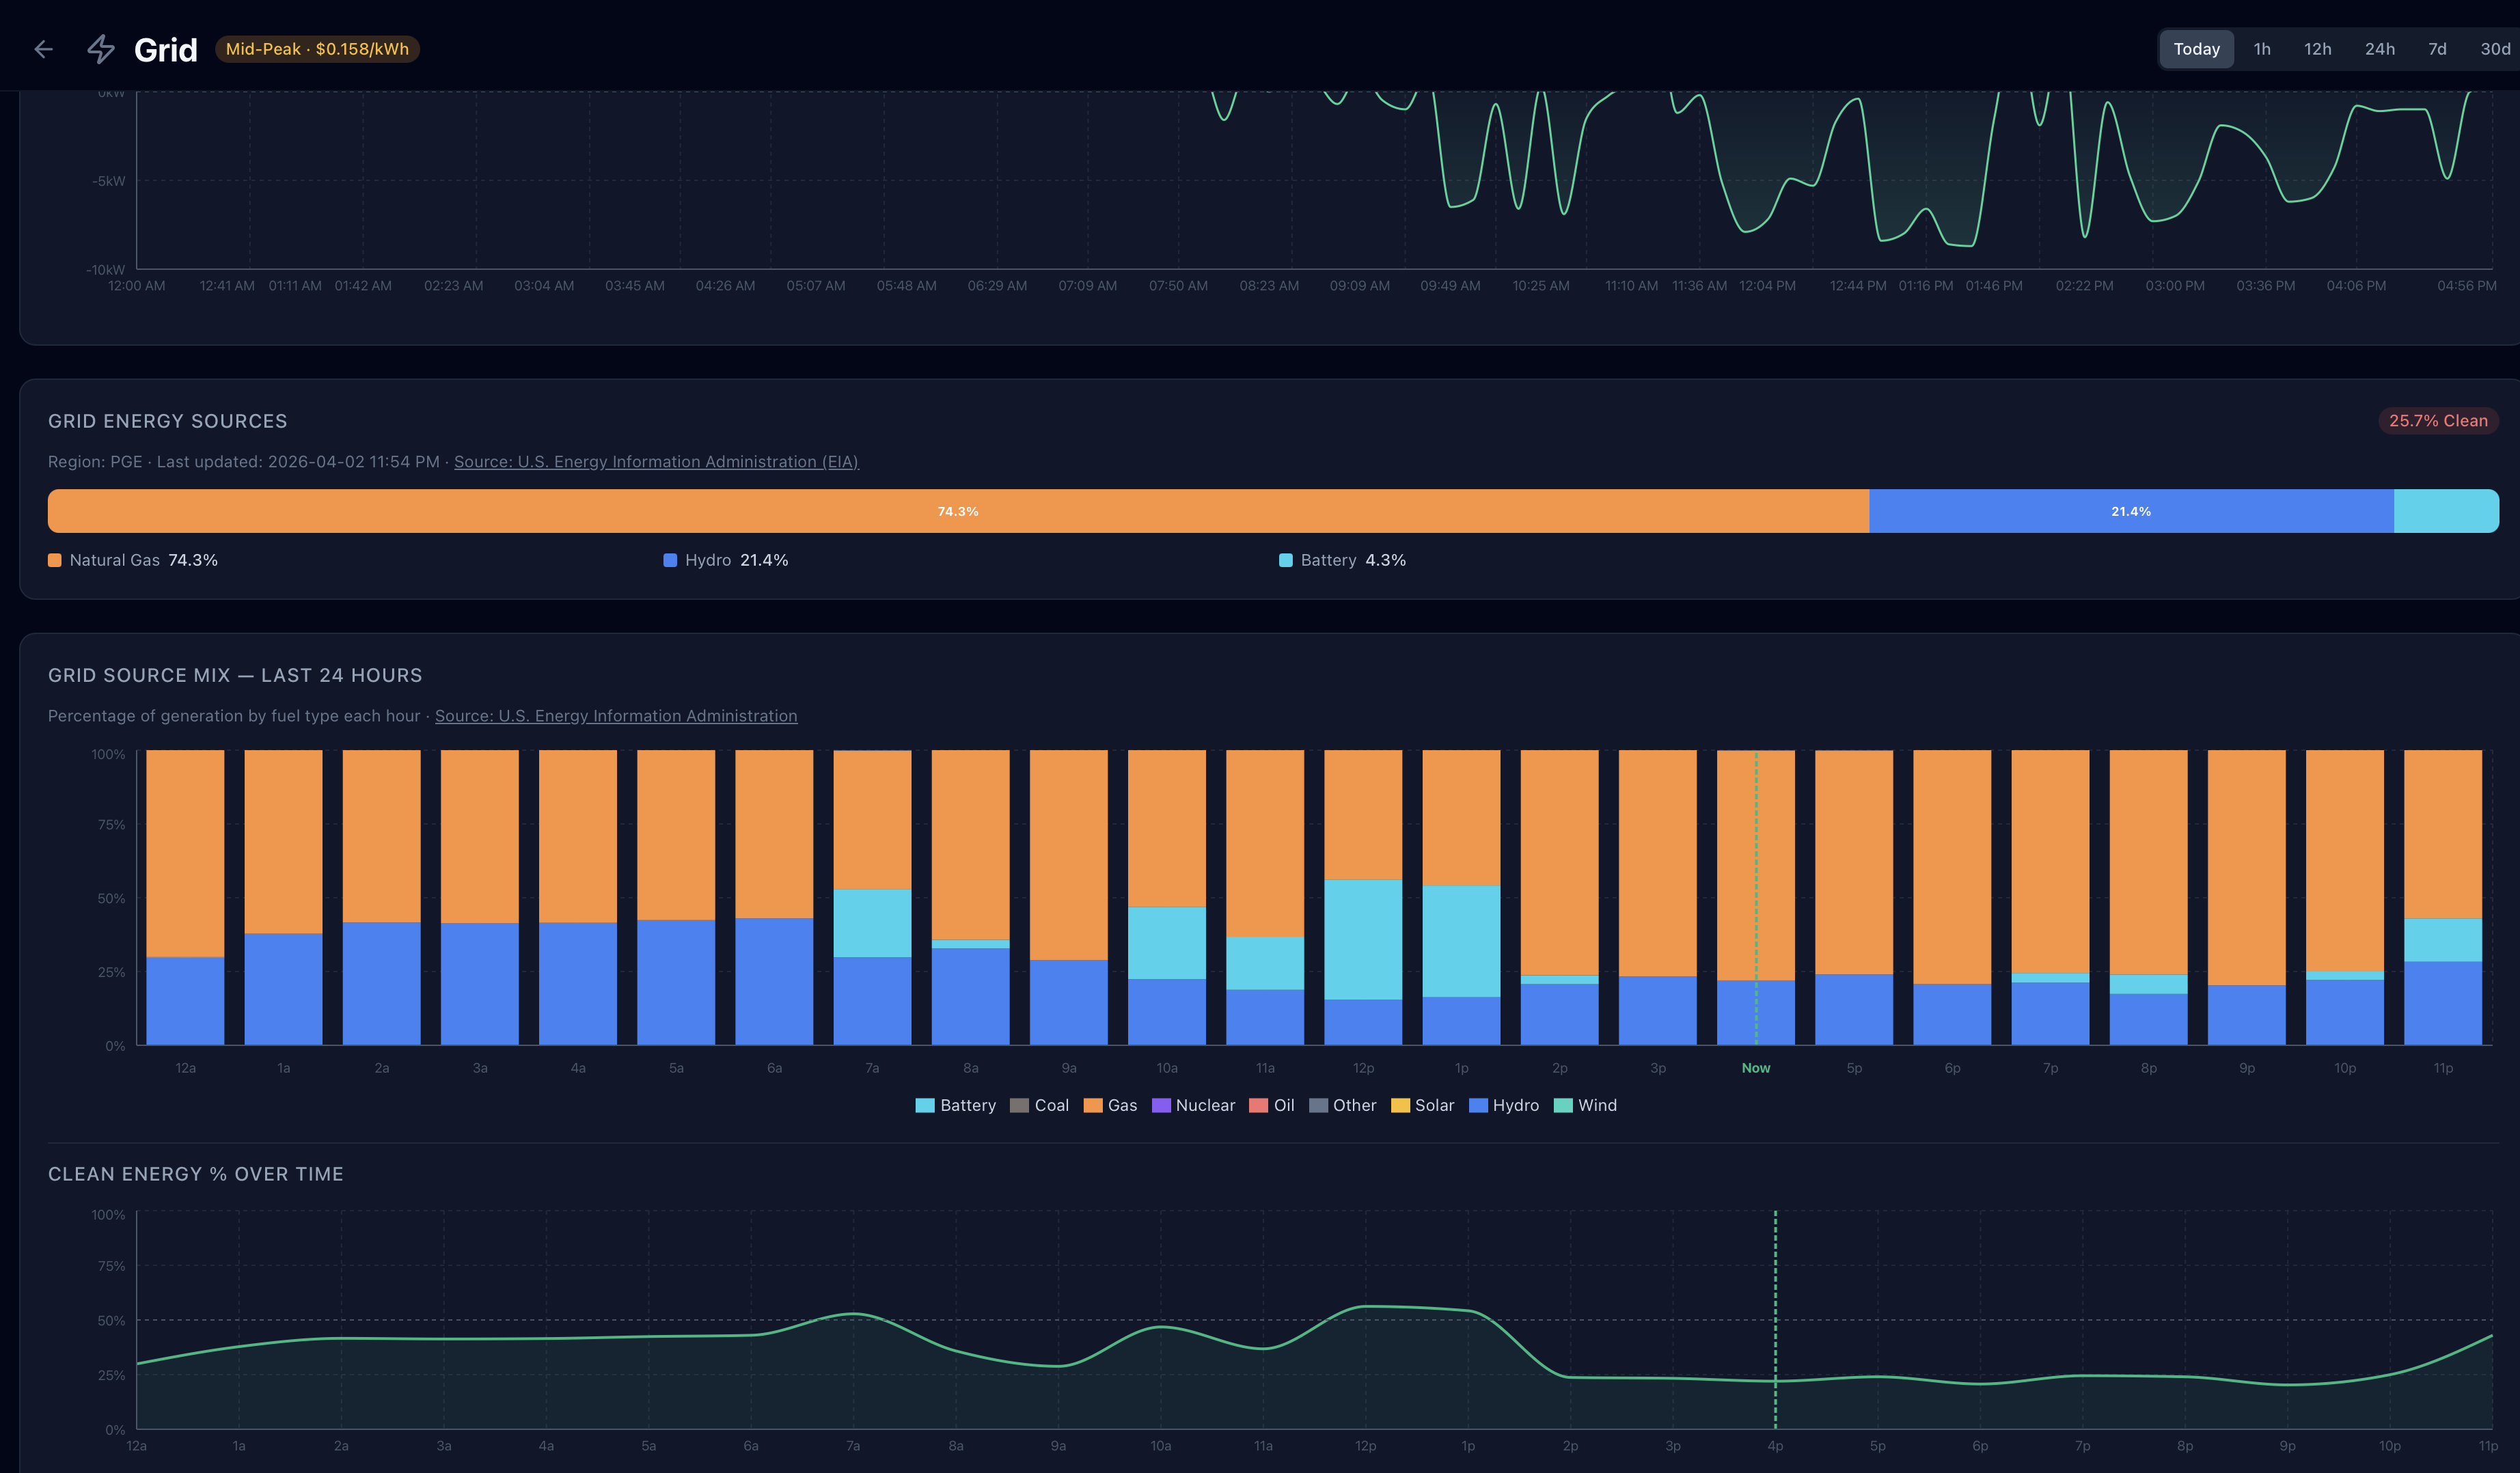
Grid Energy Mix
GridMind pulls real-time grid fuel composition data from the U.S. Energy Information Administration (EIA API). This data reflects the actual generation sources powering your local grid right now, updated hourly. The energy mix section displays:
- Stacked bar chart by fuel source — Solar, Wind, Hydro, Nuclear, Natural Gas, Coal, and Other, each color-coded
- Clean energy percentage — the combined share of renewables (solar, wind, hydro) plus nuclear on your grid right now
- Color-coded badge on the grid tile — green when your grid is over 70% clean energy, yellow between 40–70%, and orange below 40%
Grid energy mix data is for U.S. customers only and reflects your local balancing authority region. International users will see this section disabled.
Time-of-Use Rate Bands
TOU rate bands are overlaid as background shading on the power timeline chart, making it immediately visible whether your imports and exports are happening at expensive or cheap times:
- Red/dark shading — peak hours (highest rates; most valuable time to export, most expensive time to import)
- Amber shading — mid-peak hours (moderate rates)
- No shading — off-peak hours (lowest rates; best time for grid charging)
This overlay makes it immediately obvious whether your battery discharge is aligned with peak export windows and whether any grid imports are occurring during expensive periods.
Clean Energy Preference
A toggle on the Grid page allows you to enable Prefer self-consumption on clean grid. When this setting is on and your grid is generating more than 80% renewable energy, GridMind slightly relaxes export optimization to prioritize self-consumption during clean grid periods. This is designed for users who want to minimize their carbon footprint even when doing so reduces peak export earnings.
This setting has no effect when the grid is below the 80% clean threshold. To enable it: Grid → Clean Energy Preference toggle.
TOU Rate Configuration
Configure your utility’s time-of-use rates in Settings → TOU Rates. GridMind uses these rates to calculate the value of your exports and imports, power GridMind Optimize, and overlay rate bands on charts.
| Rate Period | Example Rate | Example Hours |
|---|---|---|
| Peak | $0.56/kWh | 4:00 PM – 9:00 PM |
| Mid-Peak | $0.28/kWh | 9:00 AM – 4:00 PM |
| Off-Peak | $0.18/kWh | 9:00 PM – 9:00 AM |
| Export (NEM) | $0.10/kWh | All hours |
Check your utility bill or your utility’s website for exact rate schedules. Many utilities have seasonal rates — update GridMind when your rates change (usually April and November).
Power Timeline
The detailed power chart shows grid import and export over time:
- Above the zero line — importing from the grid
- Below the zero line — exporting to the grid
- TOU bands — overlaid as background shading so you can see the rate context for every moment
- Time ranges — Today, 1h, 12h, 24h, 7d, and 30d selectors at the top of the chart
The power timeline is one of the most useful views for understanding how well GridMind Optimize is performing. Ideally you want to see exports concentrated in the red/peak band and imports (if any) confined to the unshaded off-peak hours.
Daily Grid Summary
A table below the chart shows daily grid statistics for historical analysis:
- Date
- Import (kWh) — total grid energy consumed that day
- Export (kWh) — total solar energy sent to the grid that day
- Net (kWh) — import minus export; negative means you were a net exporter that day
- Peak period import (kWh) — the portion of imports that occurred during peak rate hours (the most expensive portion of your bill)
- Peak period export (kWh) — the portion of exports during peak hours (the highest-value portion of your NEM credits)
Monitoring peak period import over time is the clearest indicator of whether GridMind Optimize is working — a well-tuned system should show near-zero peak period imports on days with adequate solar generation.