Battery
Your battery is the heart of your energy system. The Battery page gives you complete visibility into its state, health, and history — from real-time state of charge to long-term capacity trends and grid outage events.
State of Charge
The circular battery gauge at the top of the page gives you an at-a-glance view of your battery’s current condition:
- Current SOC % — updated in real time as your battery charges or discharges
- Charge rate (kW) — positive values mean the battery is charging; negative values mean it’s discharging to power your home
- Color coding — green when charging, amber when discharging, slate when idle
Operation Modes
GridMind supports two Powerwall operation modes (Tesla Powerwall only):
Self-Powered Mode (default)
The battery charges from solar during the day and discharges to power your home at night. It prioritizes eliminating grid imports — your home runs on stored solar energy as much as possible before pulling from the grid.
Time-Based Control Mode
The battery charges and discharges according to your TOU schedule. This mode is ideal when combined with GridMind Optimize, which uses time-based control to maximize export earnings during peak rate hours.
To switch modes: open the Battery page and use the Operation Mode control. (For multi-site users, controls apply to the currently active site.)
Backup Reserve
The backup reserve is the minimum state of charge your battery will maintain regardless of normal charge and discharge logic. This capacity is held in reserve specifically for grid outage backup power — it will not be used for self-consumption or export optimization.
- Default: 20%
- Minimum recommended: 20% (provides approximately 2–4 hours of backup for an average home)
- During Storm Watch: automatically raised to 100%
- Configuration: Battery page → Backup Reserve slider
Multi-site users: Battery controls, health metrics, and outage history are scoped to your currently active site. Switch sites from the site picker to view battery data for a different location.
Setting backup reserve to 0% means your battery will discharge completely during peak export, leaving no backup power if the grid goes down unexpectedly.
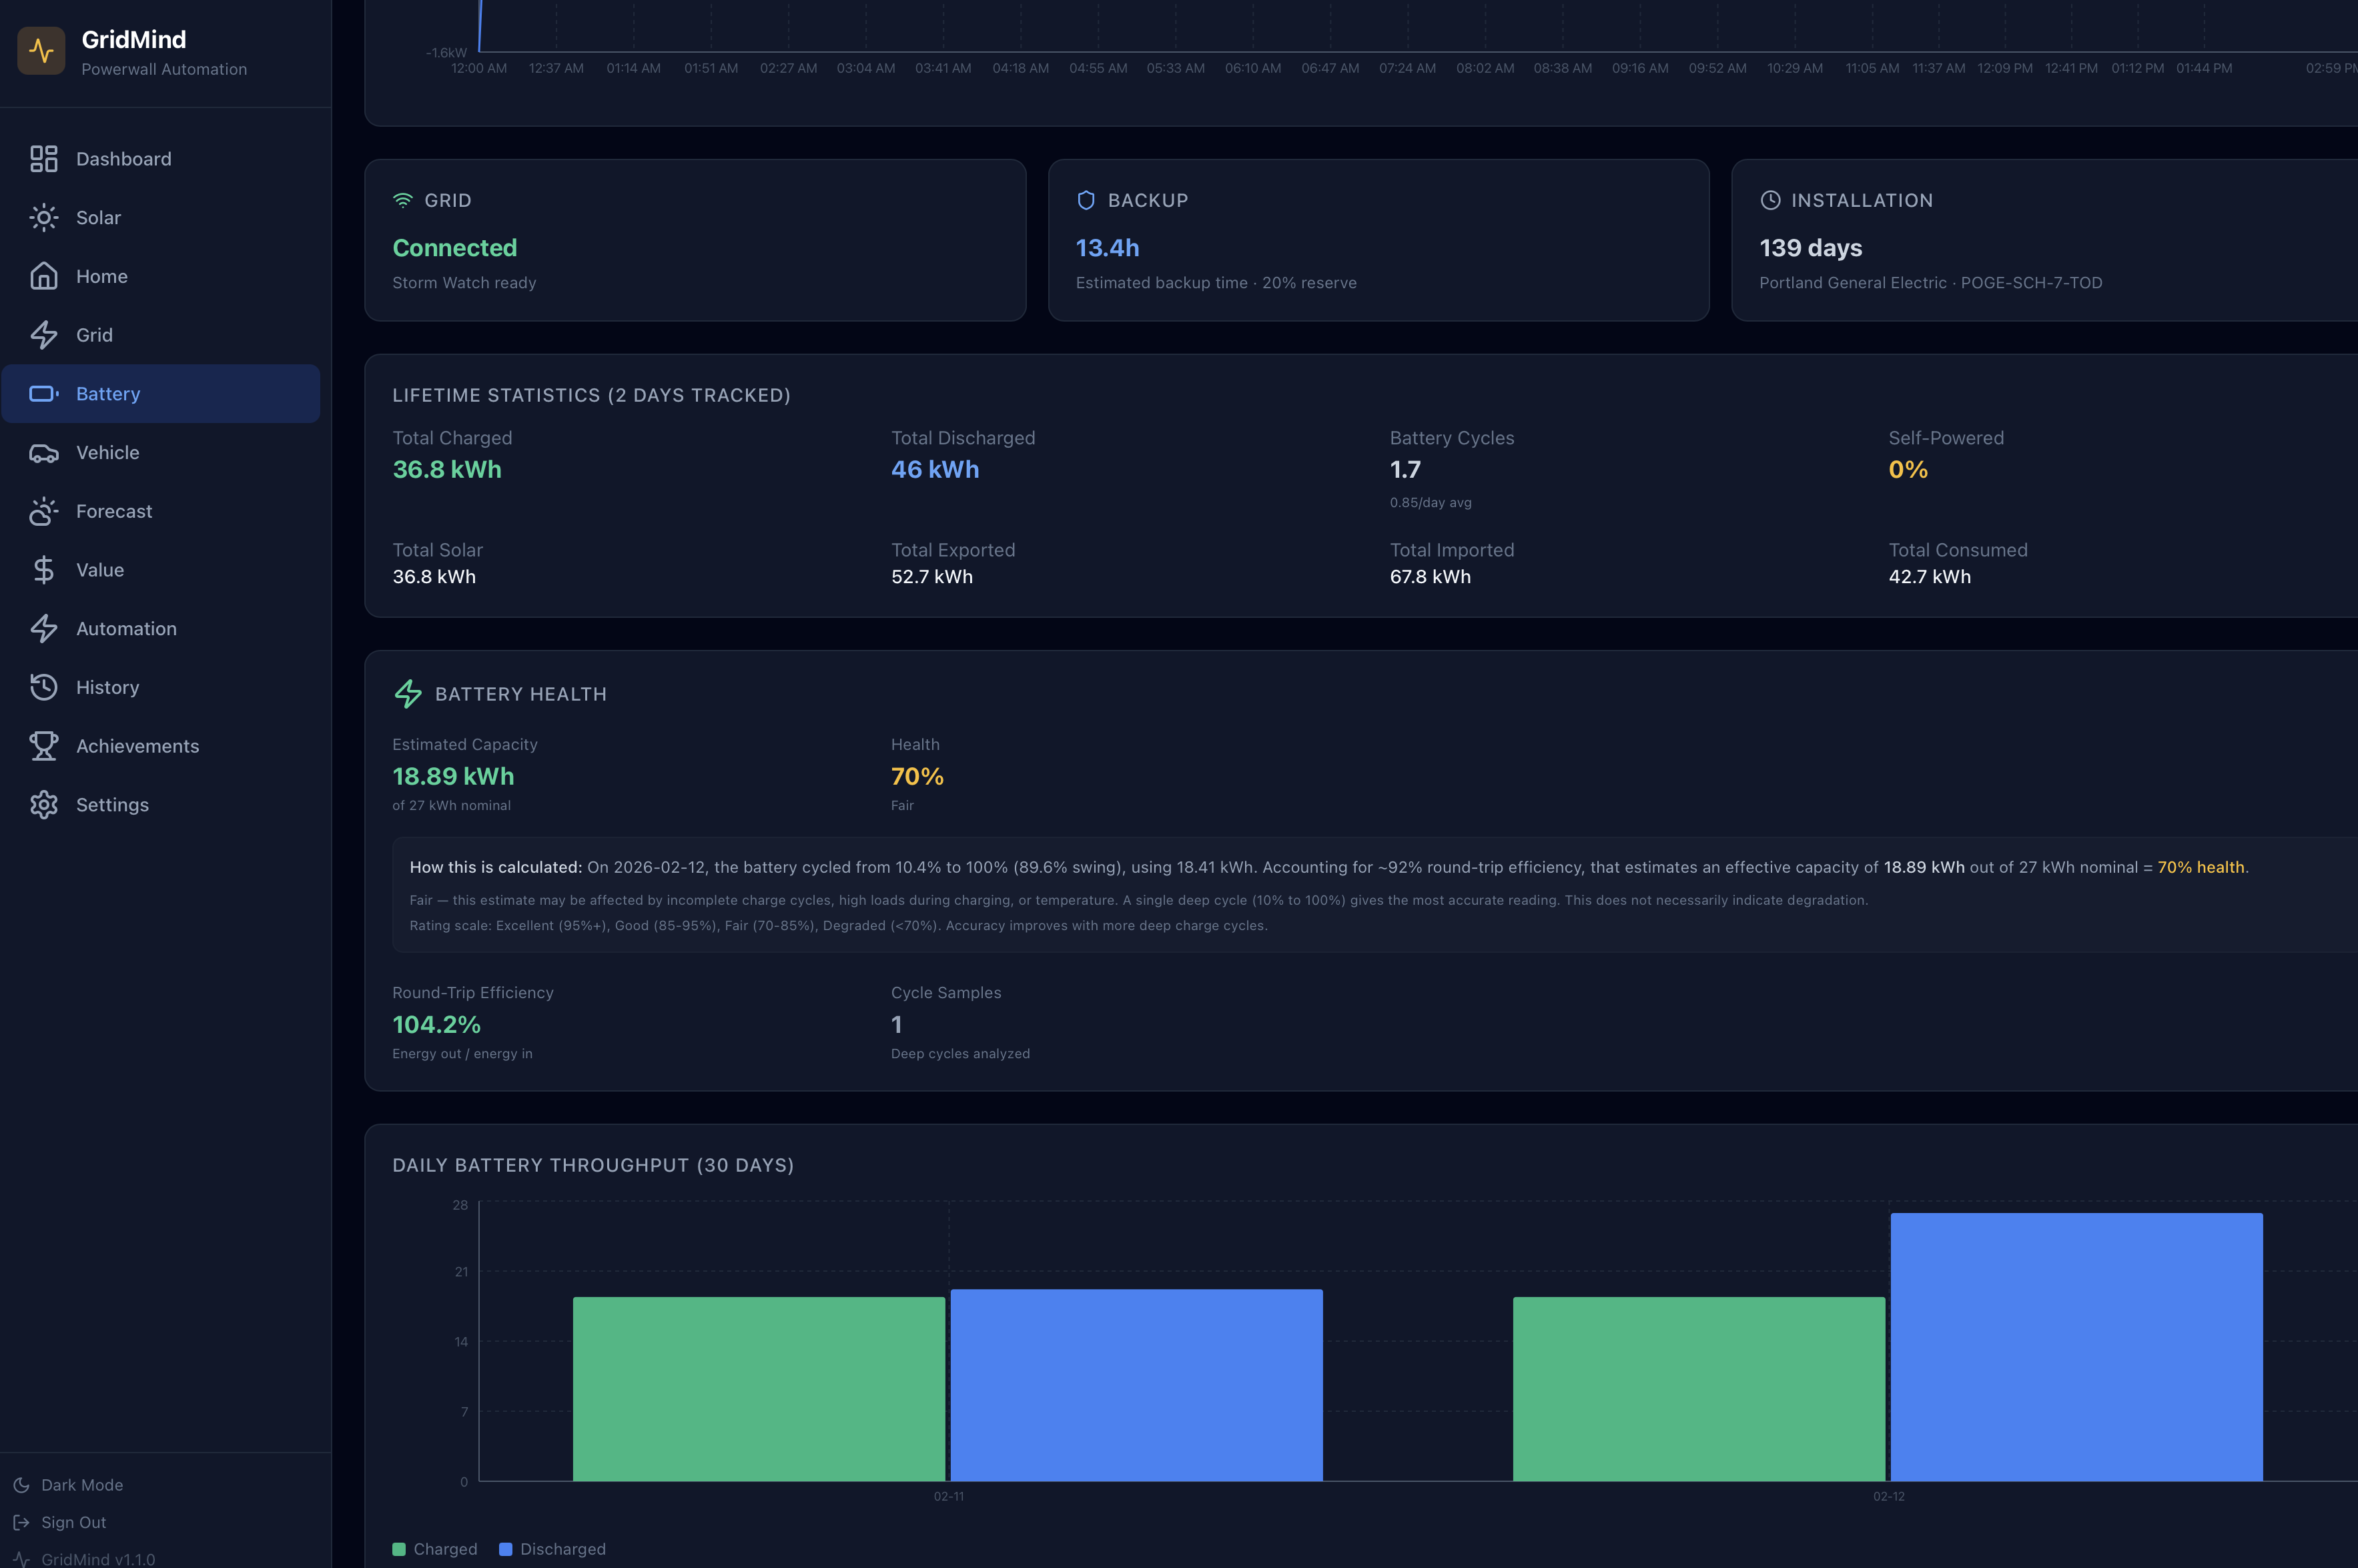
Battery Health
GridMind tracks your battery’s health over time using observed charge and discharge data. The battery health section shows:
- Estimated capacity (kWh): Calculated from observed charge cycles. A new Powerwall 2 holds approximately 13.5 kWh; capacity decreases gradually over time as the battery ages.
- Degradation %: Estimated capacity loss since installation, calculated from cycle data over your battery’s lifetime.
- Total cycles: Lifetime charge and discharge cycles. One full cycle is defined as 0% → 100% → 0%; partial cycles are accumulated proportionally.
- Capacity trend chart: A line chart showing capacity estimates over the past 30 or more cycles, letting you see whether degradation is accelerating or stable.
GridMind estimates capacity from real charge and discharge data. After 10–20 full cycles, the estimate becomes very accurate. Early readings may vary by ±5% as the model calibrates to your specific battery.
Charge Cycle History
A table shows your recent charge cycles with the following columns:
- Date — when the cycle occurred
- Starting SOC (%) — battery level at the start of the cycle
- Ending SOC (%) — battery level at the end of the cycle
- Cycle depth (%) — the total swing in state of charge
- Energy throughput (kWh) — total energy moved through the battery during the cycle
Deep cycles (large cycle depth) contribute more to total degradation than shallow cycles. If GridMind Optimize is enabled, it naturally reduces average cycle depth by targeting partial charge windows aligned with TOU peaks.
Grid Outage Events
GridMind logs every grid outage your system has detected and backed up. Each outage event record includes:
- Start time and end time — precise timestamps when the grid went down and came back
- Duration — how long the outage lasted
- Battery SOC at outage start and end — how much charge you had going in and how much remained when power returned
- Estimated energy provided during outage (kWh) — calculated from SOC change and estimated battery capacity
This history is invaluable for understanding how much backup capacity you actually need. If your battery consistently still has 60% charge remaining when the grid returns, you may not need to increase your backup reserve. If it’s running close to empty, consider raising your reserve or adding battery capacity.
Storm Watch
GridMind monitors a 7-day weather forecast for your location. When severe weather is detected — including thunderstorms, high winds (gusts over 50 mph), heavy rain or snow, and other high-impact events — Storm Watch activates automatically:
- Storm Watch activates and overrides normal battery logic
- The backup reserve is temporarily raised to 100%
- GridMind charges the battery to 100% as quickly as possible using available solar and grid power
- A Storm Watch banner appears on the dashboard with the active weather event details
Storm Watch automatically deactivates when the severe weather window passes, and normal operation (including any active Optimize schedule) resumes.
Storm Watch works even if GridMind Optimize is enabled. Optimize is automatically paused during Storm Watch and resumes after the weather event clears, picking up the next scheduled TOU window.
Time Range Selector
Use the time range tabs at the top of the battery charts to explore data over different periods:
- Today — minute-by-minute SOC chart for the current day
- 1h / 12h / 24h — recent sliding windows showing the last hour, 12 hours, or 24 hours of data
- 7 days — daily minimum and maximum SOC values and cycle counts for the past week
- 30 days — monthly health trend showing capacity estimates and degradation over the past month