Value & Finances
The Value page translates your energy data into dollars — showing exactly how much your solar and battery system is earning and saving you. Rather than abstract kilowatt-hours, you see the real financial impact of every solar ray and every battery cycle.
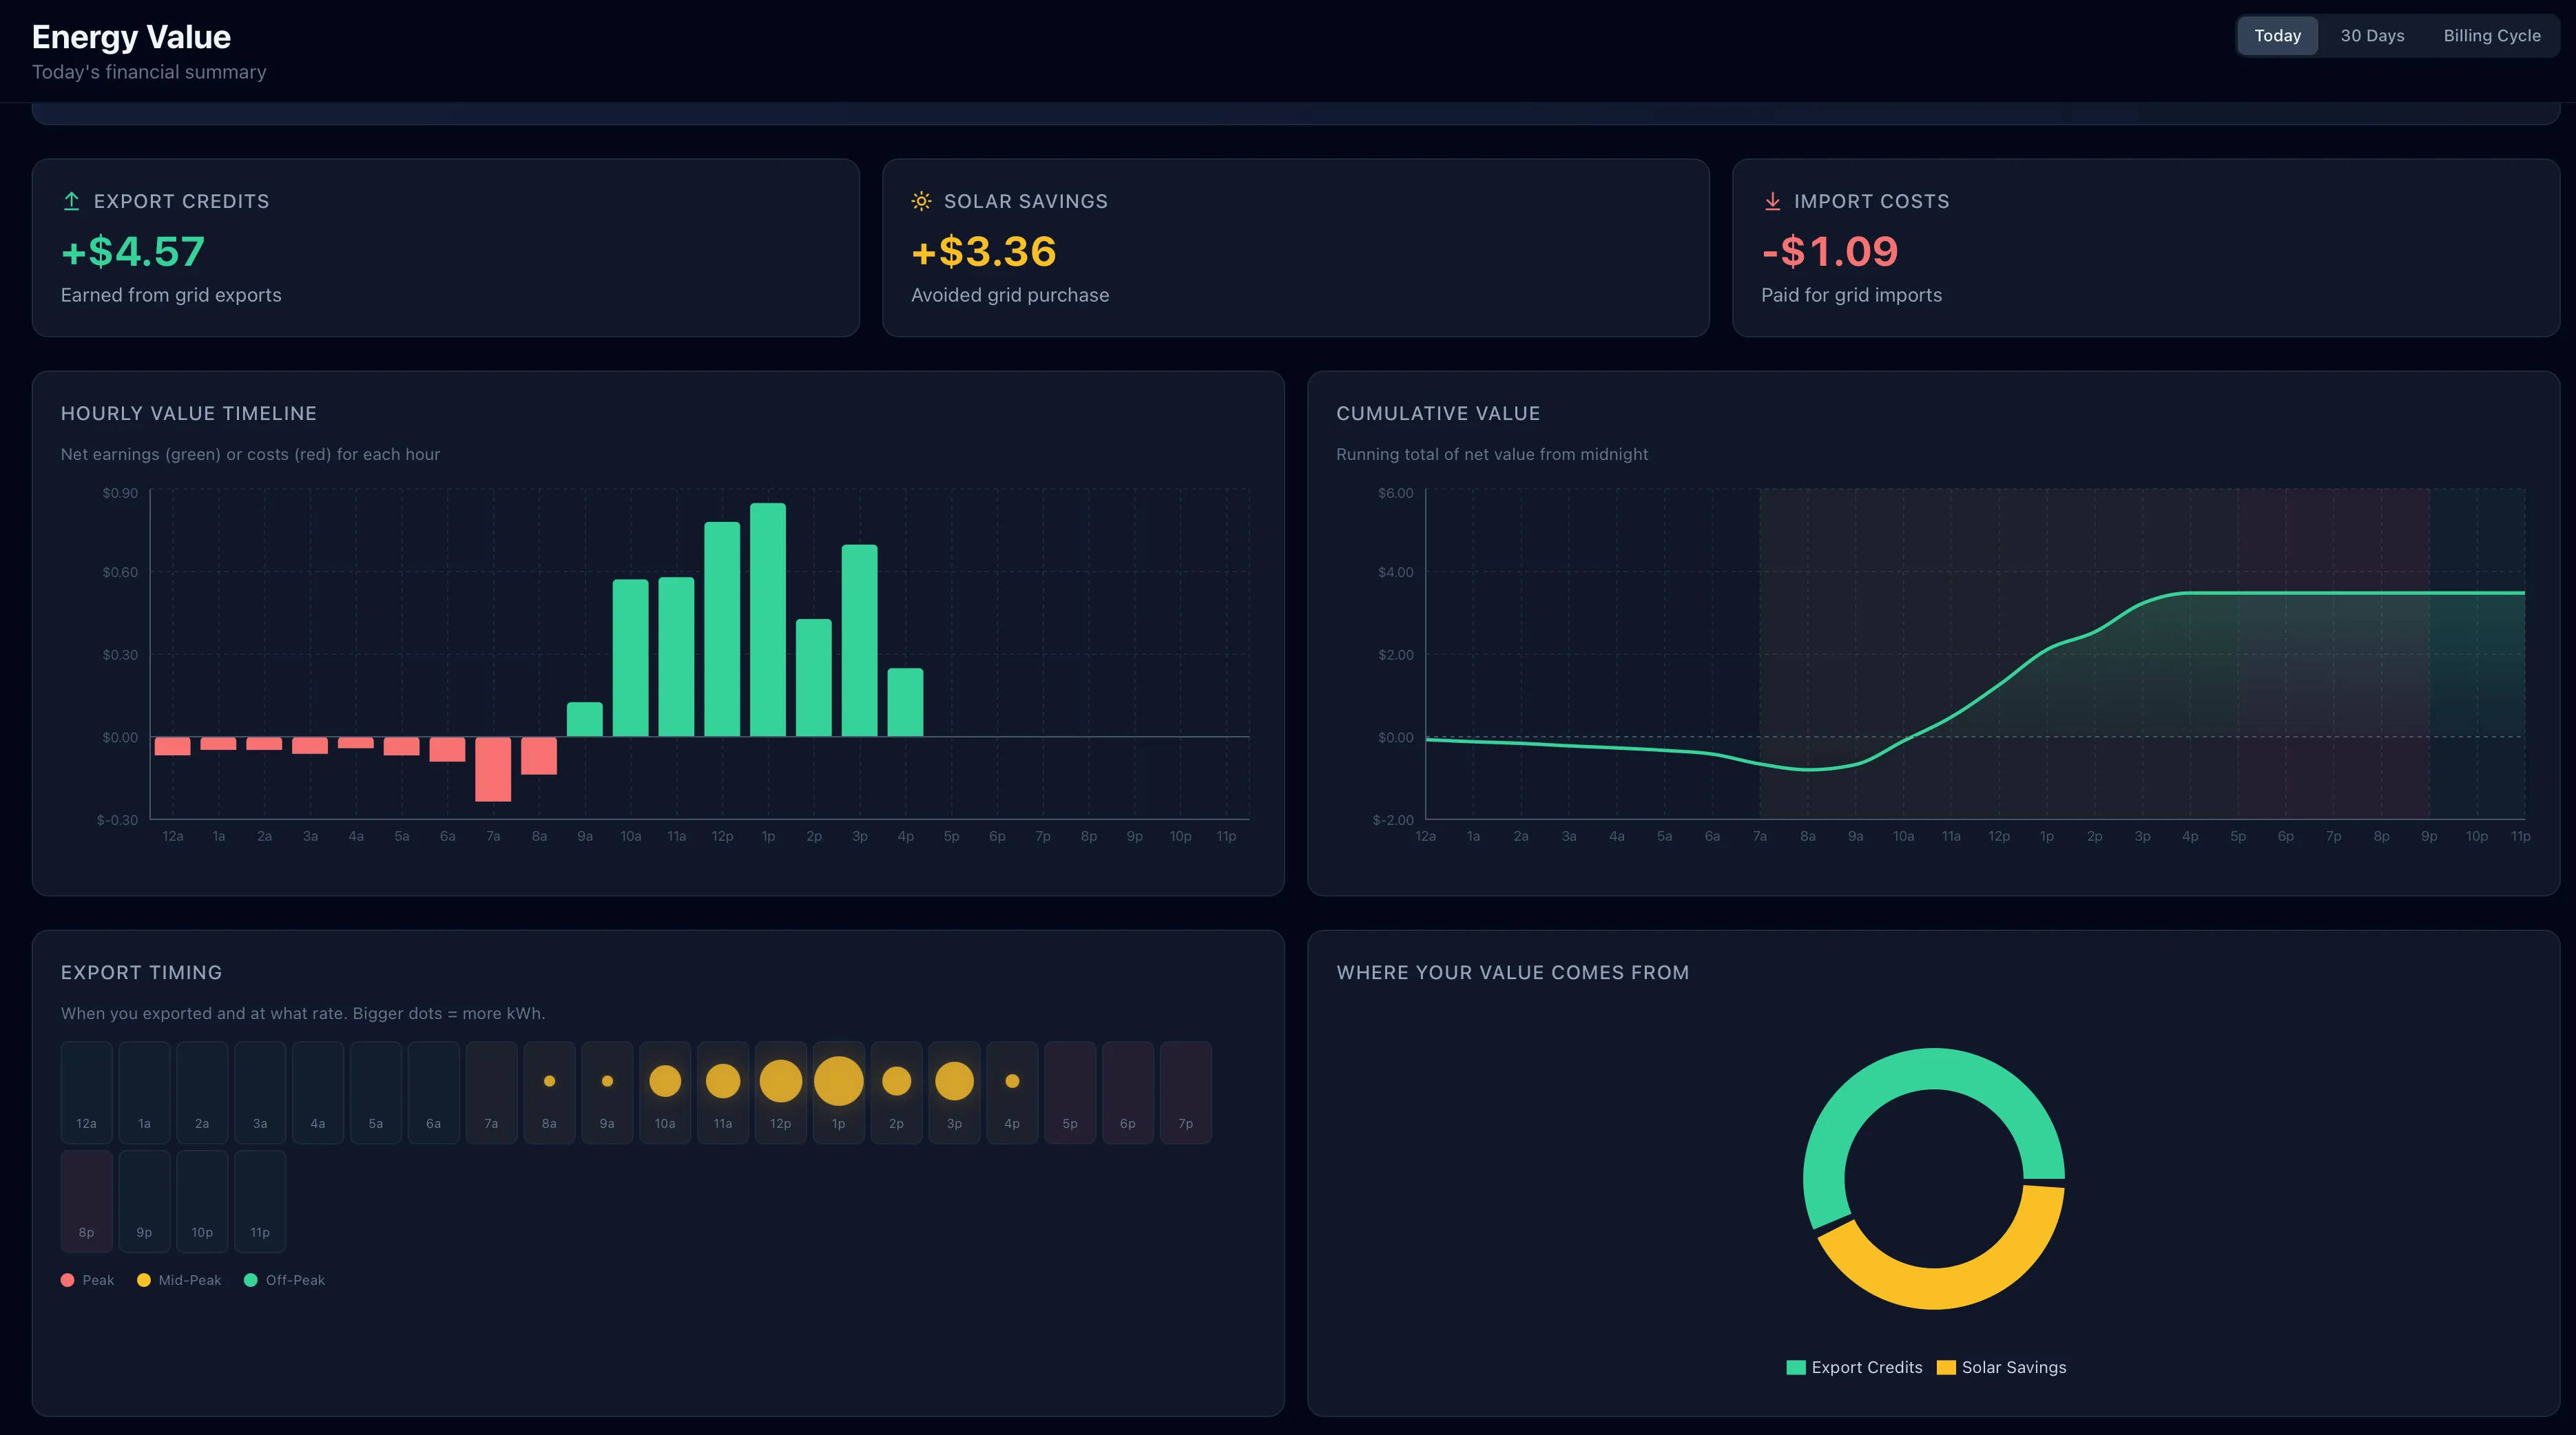
Value Summary
The top section shows the most important financial metrics for your selected time range:
- Export Credits — Revenue from selling solar energy back to the grid at your NEM or export rate. The explainer behind the card speaks your plan’s language: on a plan that banks kilowatt-hours it says exports become banked credits rather than a cash payment; on a dollar-banking plan it explains credits earned at the export rate for the hour you export.
- Import Savings — Money saved by using solar or battery power instead of buying grid power at peak rates
- GridMind Optimize Savings Pro — Additional savings specifically from the TOU peak strategy — the difference between optimized and unoptimized battery behavior
- Net Value — Export credits and import savings combined into a single total
- VPP Earnings — Revenue from Virtual Power Plant events, shown separately when applicable
Each metric shows the value for your currently selected time range, along with a trend indicator comparing it to the equivalent prior period.
Energy Credits Pro
If your utility banks excess solar as credits under a net-metering plan, the Value page also carries an Energy credits card: the balance your utility is holding for you, how it moved this billing cycle, and a link to the detail page, where the bank is drawn day by day. It is anchored to the balance printed on your bill, so it tracks what the utility will actually apply on the days you import. See Energy Credits for how the bank is computed and how to set up your plan.
The Value Page on a Kilowatt-Hour Plan
On a plan that banks kilowatt-hours — Oregon net metering, for example — dollars are the wrong lens. Your utility nets the whole billing cycle before it banks anything, so a kilowatt-hour exported at peak is worth exactly one imported at night, and “export credits” are energy, not cash. Once your energy-credits plan is on, the Value page changes shape, and a line under the title says so: Showing your energy bank — from your Oregon net metering plan.
- Energy to your bank leads the page — the net kilowatt-hours you added to (or drew from) your bank in the selected range. While your cycle is short, the same figure reads as cutting your shortfall, and the Dashboard’s Exported card shows today’s net kilowatt-hours to your bank.
- Net energy instead of dollar estimates — the daily and hourly timelines show net kilowatt-hours to or from your bank, and GridMind Optimize history shows energy sent to your bank instead of earnings.
- The three things that move your bank — Battery round trips (energy lost cycling the battery), Peak-hour imports (on-peak usage your exports did not cover) and Bank at true-up (credits that would be forfeited) replace the peak-earnings cards.
- Estimated bill this cycle — GridMind nets your exports and banked credits against your imports peak-first, prices only what is left, and says how much of your imports the bank paid for: 412 kWh imported · 380 kWh covered by exports and your bank · 32 kWh billed. Add your utility’s fixed monthly charge and tax rate in the plan settings to see the full bill. The estimate is arithmetic on your own data and needs no AI consent.
- Lifetime system value — what you would have paid without solar minus what your energy actually cost after netting. Exports do not count as cash, and energy forfeited at true-up counts as nothing.
On dollar-banking plans such as California NEM 2.0 the page keeps its dollar lens, and the peak-export cards come first because timing is the lever there.
Time Range Selector
Switch between three views to see your finances across different time horizons:
- Today — Running totals for the current day, updated live as solar generates and your battery charges and discharges
- 30 Days — Aggregated financial data for the last 30 days, useful for understanding your monthly earnings trajectory
- Billing Cycle — Your current utility billing period, so the numbers you see match what will appear on your next electricity bill. Set your bill reset day in Settings to align this with your actual utility cycle.
Hourly Value Timeline
A bar chart shows the financial value generated each hour throughout the day. Each bar represents the net dollar value earned or saved during that hour, and bars are color-coded by TOU period:
On a plan that banks kilowatt-hours the bars show net kilowatt-hours to or from your bank instead of dollars.
- Dark red/amber bars — Peak hours, when your export rate is highest and import savings are greatest
- Neutral bars — Off-peak hours, where the value per kWh is lower
This visualization makes it immediately clear which hours your system is generating the most financial value and whether your battery is actually discharging during the right windows.
GridMind Optimize Savings
ProThis section is only available with a Pro subscription. Upgrade to Pro →
This section breaks out the incremental financial benefit of running GridMind Optimize — the additional earnings you captured beyond what simple self-powered mode would have delivered. It answers the question: “How much more am I making because GridMind is managing my battery?”
- Today’s savings — Optimize earnings so far today
- Recent daily average — Average Optimize savings per day over the last 30 days
- Monthly savings total — Total Optimize-attributed savings for the current billing cycle or month
- Lifetime savings — Cumulative Optimize savings since you first enabled it
- Average $/day — A simple daily average across the lifetime of Optimize usage
These figures are calculated by comparing your actual battery export behavior (with Optimize managing timing and discharge rate) against a simulated baseline of simple self-powered mode using the same solar production and home load data.
VPP Event Earnings
If you participate in Virtual Power Plant events, this section shows the earnings history from each event separately from your regular export revenue — because VPP export rates are typically many times higher than your standard NEM rate.
For each event you’ll see:
- Event date and duration — When the event occurred and how long it ran
- Premium export rate — The $/kWh rate paid during that event
- Energy exported (kWh) — How much battery energy your system exported to the grid
- Earnings — Total revenue from that event
A running total at the bottom of the section shows your cumulative VPP earnings across all events.
Lifetime System Value
Below the time-range-specific metrics, a lifetime summary shows your system’s total financial performance since GridMind started tracking:
- Total export credits earned — All-time revenue from NEM and VPP exports
- Total import savings — All-time value of avoided grid purchases
- Combined lifetime value — The sum of both, representing total financial benefit delivered by your system
- Break-even progress — A progress bar and percentage showing how far you’ve come toward recouping your system’s installation cost
Set your system installation cost in Settings → Location & Solar to enable break-even tracking. Without this value entered, the break-even progress bar will not appear.
Setting Your Billing Cycle
By default, GridMind calculates the “Billing Cycle” view from the 1st of each month. If your utility bills on a different schedule, you can align the view with your actual statement period:
- Go to Settings → TOU Rates
- Find the Bill reset day field
- Enter the day of the month your billing cycle starts (for example, enter
15if your cycle runs from the 15th to the 14th)
Once set, the Billing Cycle view will always show totals from your most recent bill reset day through today, matching the numbers your utility will calculate for your next bill.